Mapping of coral bottoms from different high resolution satellite images.
We have investigated the value of several high spatial resolution satellite
sensors for mapping of coral bottoms in Belize.
The sensors were evaluated for the possibility to map cover type and
changes of coral bottoms with respect to their spectral and spatial
properties. Comparisons between different sensors with similar wavelengths
have shown that almost all main structures (reef, coral sand, etc) show up
remarkably well even in lower spatial resolution (30 m cf. 4 m), but the
character within each object is much better in the higher resolution.
Unsupervised classification was applied and higher spatial resolution gave
better separation of classes within the reef, but what sensor to use was
dependant upon the purpose of the classification.
The better quantisation of the Landsat and SPOT versus IRS showed up as
sharper images.
SPOT and IKONOS data verified our earlier detection of coral bleaching in
Belize.
The following sensors were used (Table 1-2)
If the purpose is only to get a coral map over a large area, Landsat or SPOT
is less time consuming and less costly than IKONOS and often of sufficient
quality. For small areas and details IKONOS is better. More narrow spectral
bands are required in order to more accurately separate reef species and to
distinguish between bleached corals and other bottoms or between dead corals
invaded by algae and living corals.
From this study we can conclude that the IKONOS could be used for certain
mapping tasks and monitoring of bleaching. We still need a better spectral
resolution in order to define the type of change. The cost for IKONOS makes
it difficult to use in global surveys. Landsat-7 could be used for coarser
mapping and updating purposes, but in the future we need a more specific reef
sensor with a few selected narrow bands and a good spatial and temporal
resolution.
A follow up of the coral bleaching study including also
SPOT and IKONOS indicates that many bleachings were in accordance with field
observations having different spectral properties than unaffected areas and
thus verified our earlier findings.
| Satellite | Sensor | Track/Frame | Date | Sun elev. | Resampl. method | Aq. quant. (bits) |
| Landsat | TM | 19/48 | 870221 | 44 | CC | 8 |
| Landsat | TM | 19/49 | 950518 | - | - | 8 |
| Landsat | TM | 19/48 | 991129 | - | NN | Best 8 of 9 |
| IRS 1C | LISS3 | 283/06100 | 980228 | 57 | NN | 7 |
| IRs 1D | LISS3 | 292/06100 | 980831 | 71 | CC | 7 |
| SPOT | HRV 2 | K612/J318 | 980910 | - | - | 8 |
| IKONOS | MSS | *)364625 | 010313 | - | - | 11 |
| IKONOS | PAN | *)1823470 | 010313 | - | - | 11 |
The LISS-III sensors on the IRS satellites have two channels in the visible
part of the spectrum (Table 2). Unfortunately they lack a blue wavelength
band, but the green channel covers approximately the same wavelength as
channels in TM and SPOT.
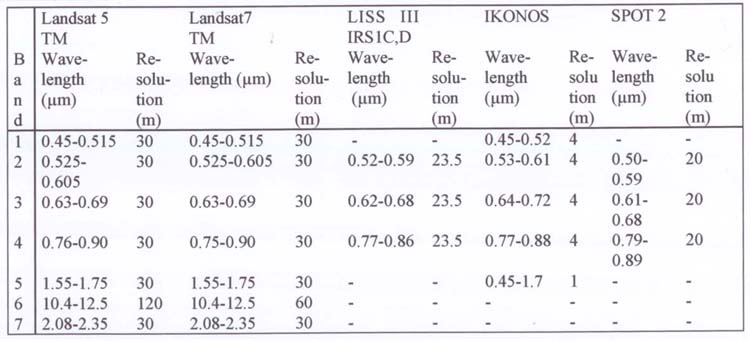
Table2. Waweleghts and spatial resolutions of the sensors.
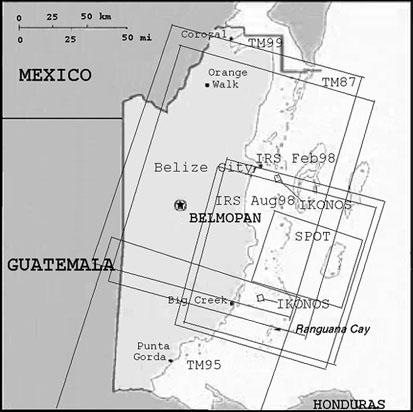
Map of the coverage of the Belize image.